 Sign in
HR Pay and Performance Benchmarking
for Local Government
Built around the structures, job families and pay frameworks councils actually use. Trusted by over 200 councils across England.
Compare yourself against the latest data from councils like yours, the moment your return is complete — no formulas, no spreadsheets.
Upload your data in a simple, intuitive format with built-in validation. Most surveys take just one return a year.
Interactive explorer dashboards, scorecards and AI-powered insights, alongside tailored PDF reports and Excel downloads.

Esterwilde's pay bill of £4,814,669 falls in the second quartile of all boroughs, and for the entire east region. It has fallen by 14.5% since the last survey in 2024/25, when it was £5,631,192. This compares with a median average change of -4.1% for the region since 2025/26.
Jump straight to the data you're looking for without any formulas or processing. Start benchmarking as soon as you complete your return, and compare with councils like yours across the country.
A wide range of visualisation options is available:
| Council | Salary | Match |
|---|---|---|
| Northgate | £31,200 | M |
| Riverside | £33,800 | M+ |
| Esterwilde | £30,100 | M |
Drill down into any category — drill through to filter everything.
Purpose-built explorer dashboards for Pay & Benefits, Chief Officer Pay, Social Workers and more. Click to drill from job families into levels, then focus the entire view on a single role to see council-by-council detail.

Instantly see what's changing and why it matters, or where you stand out from similar councils.
Get insights at the click of a button, helping you understand the context behind the numbers and identify areas that need attention.
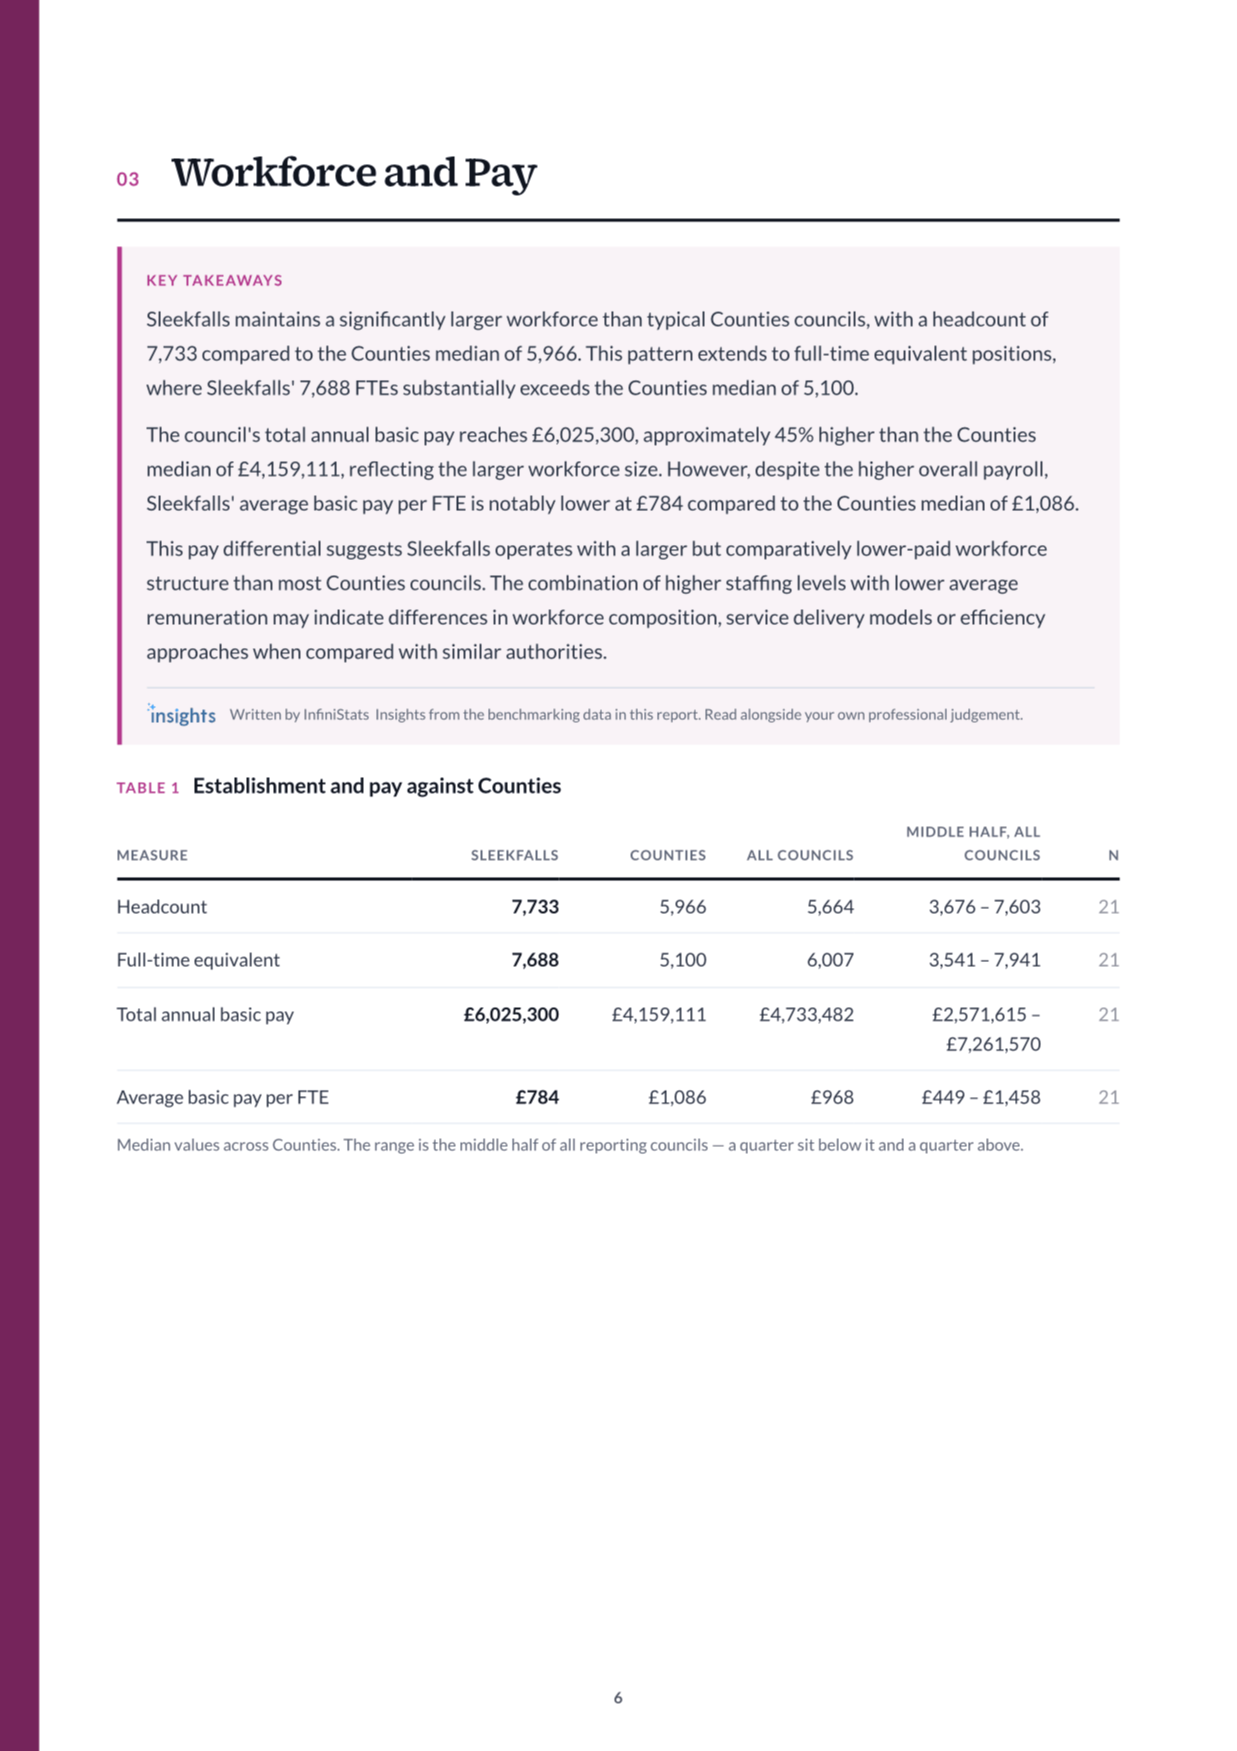
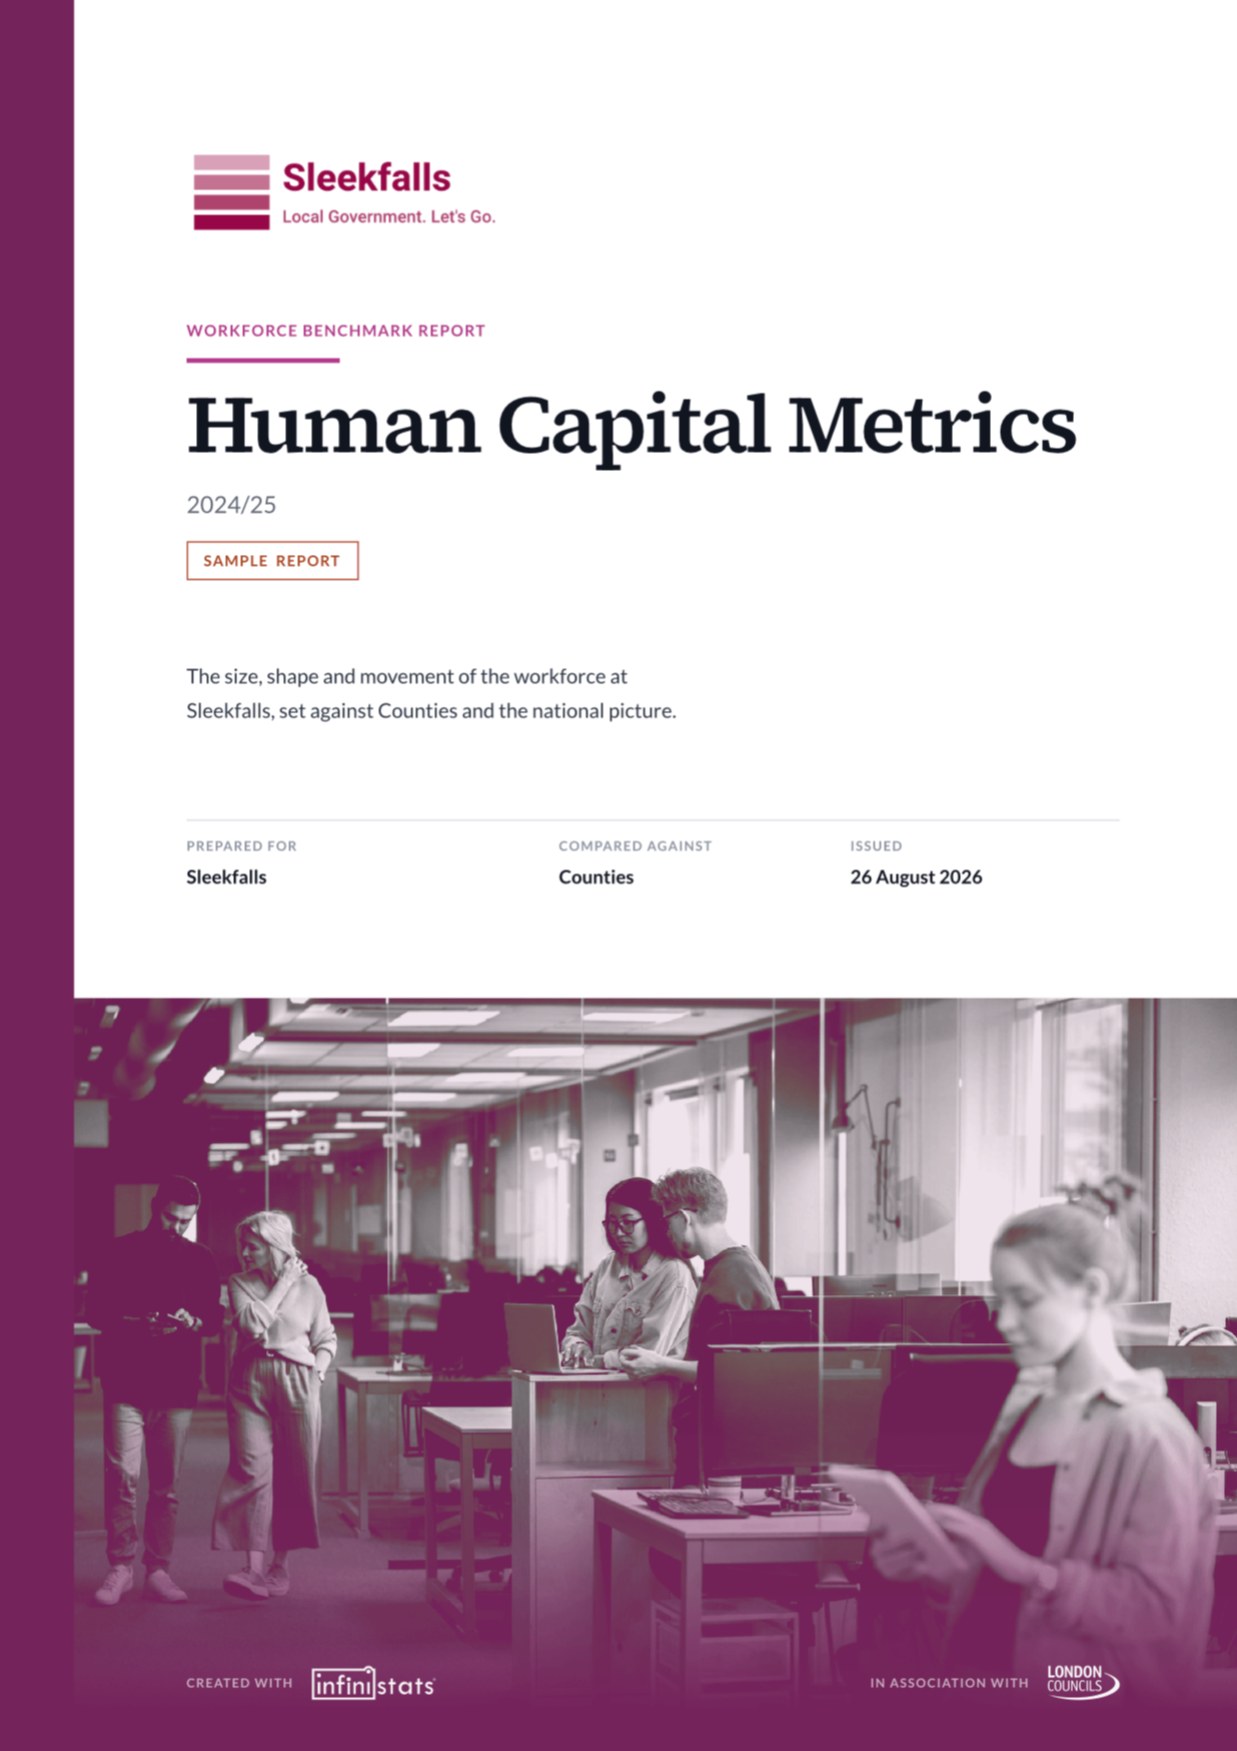
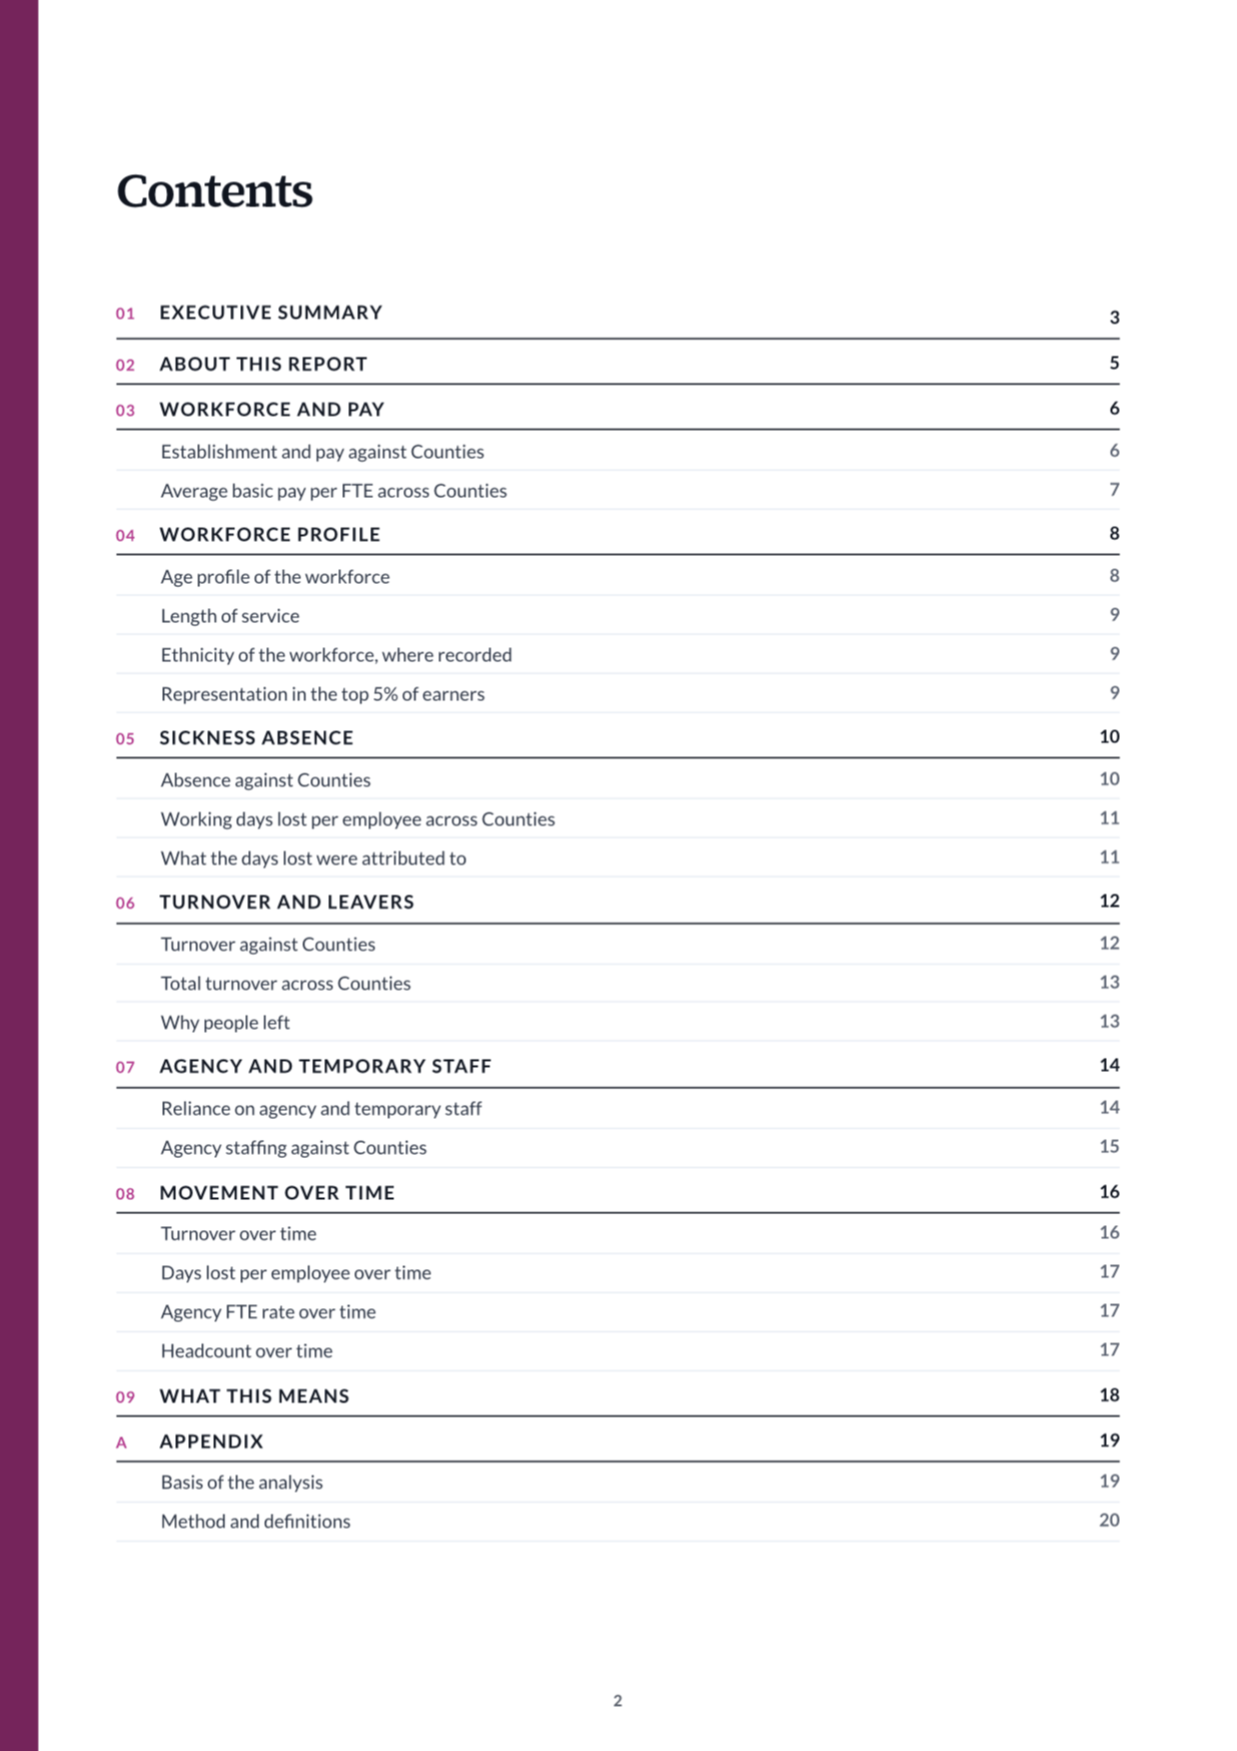
Bespoke reports with your logo and colours, including an annotated summary of the data including trend analysis.
Customise report contents and add your own annotations and commentary.
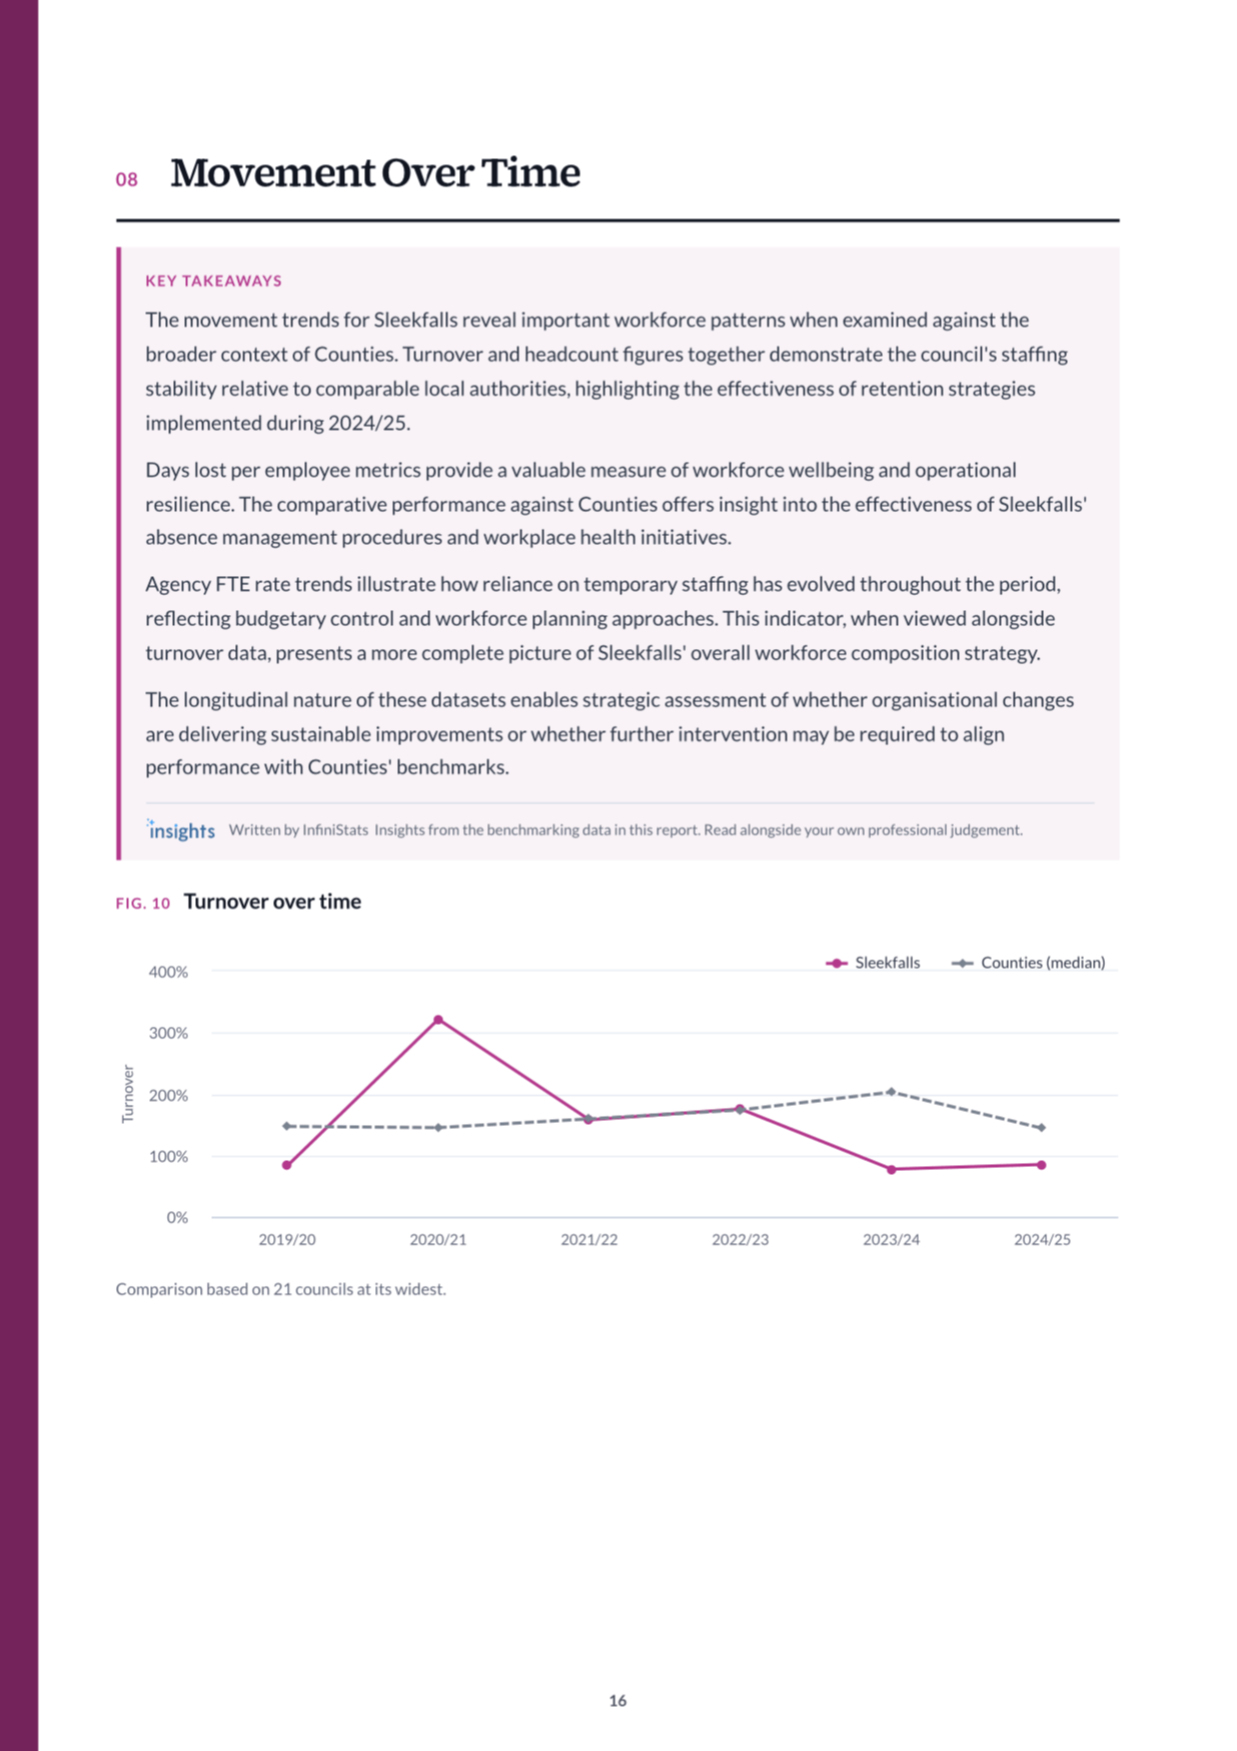
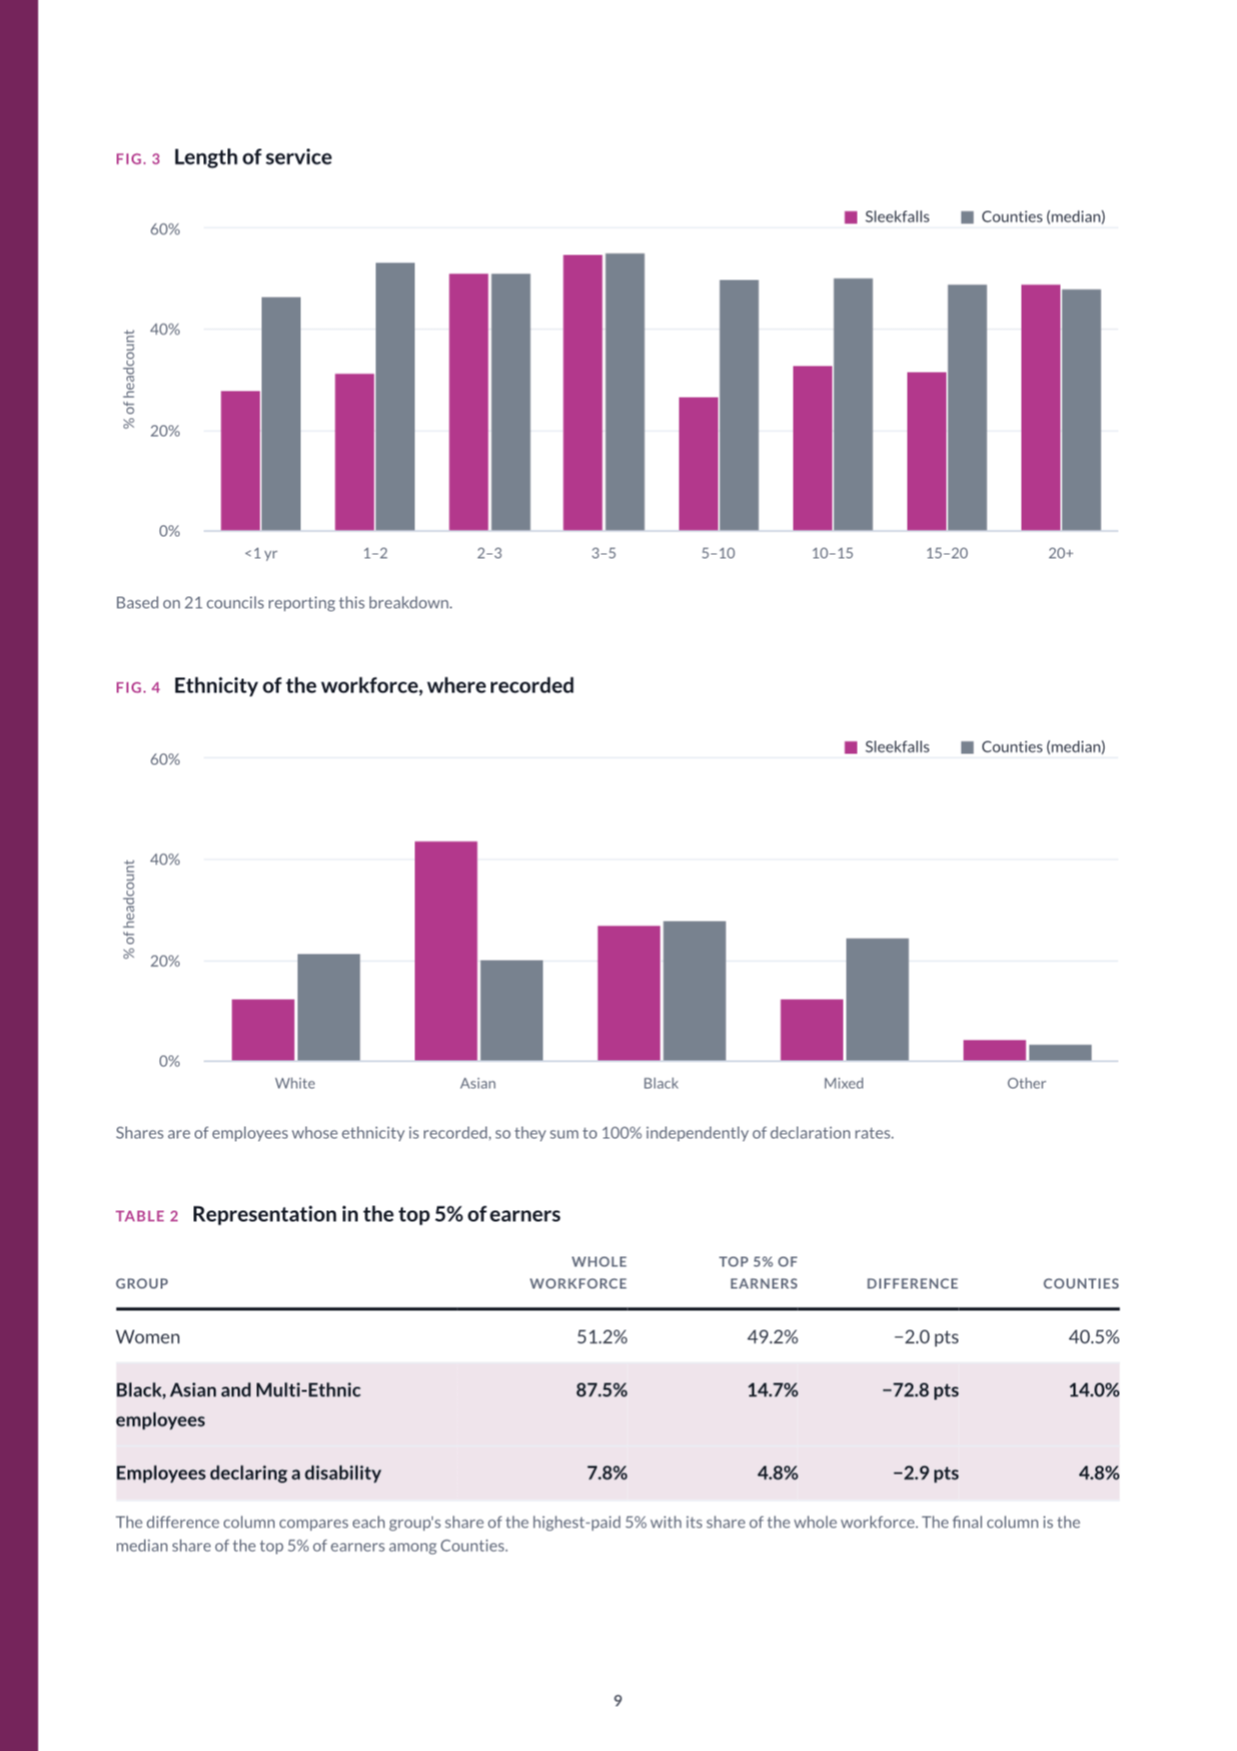
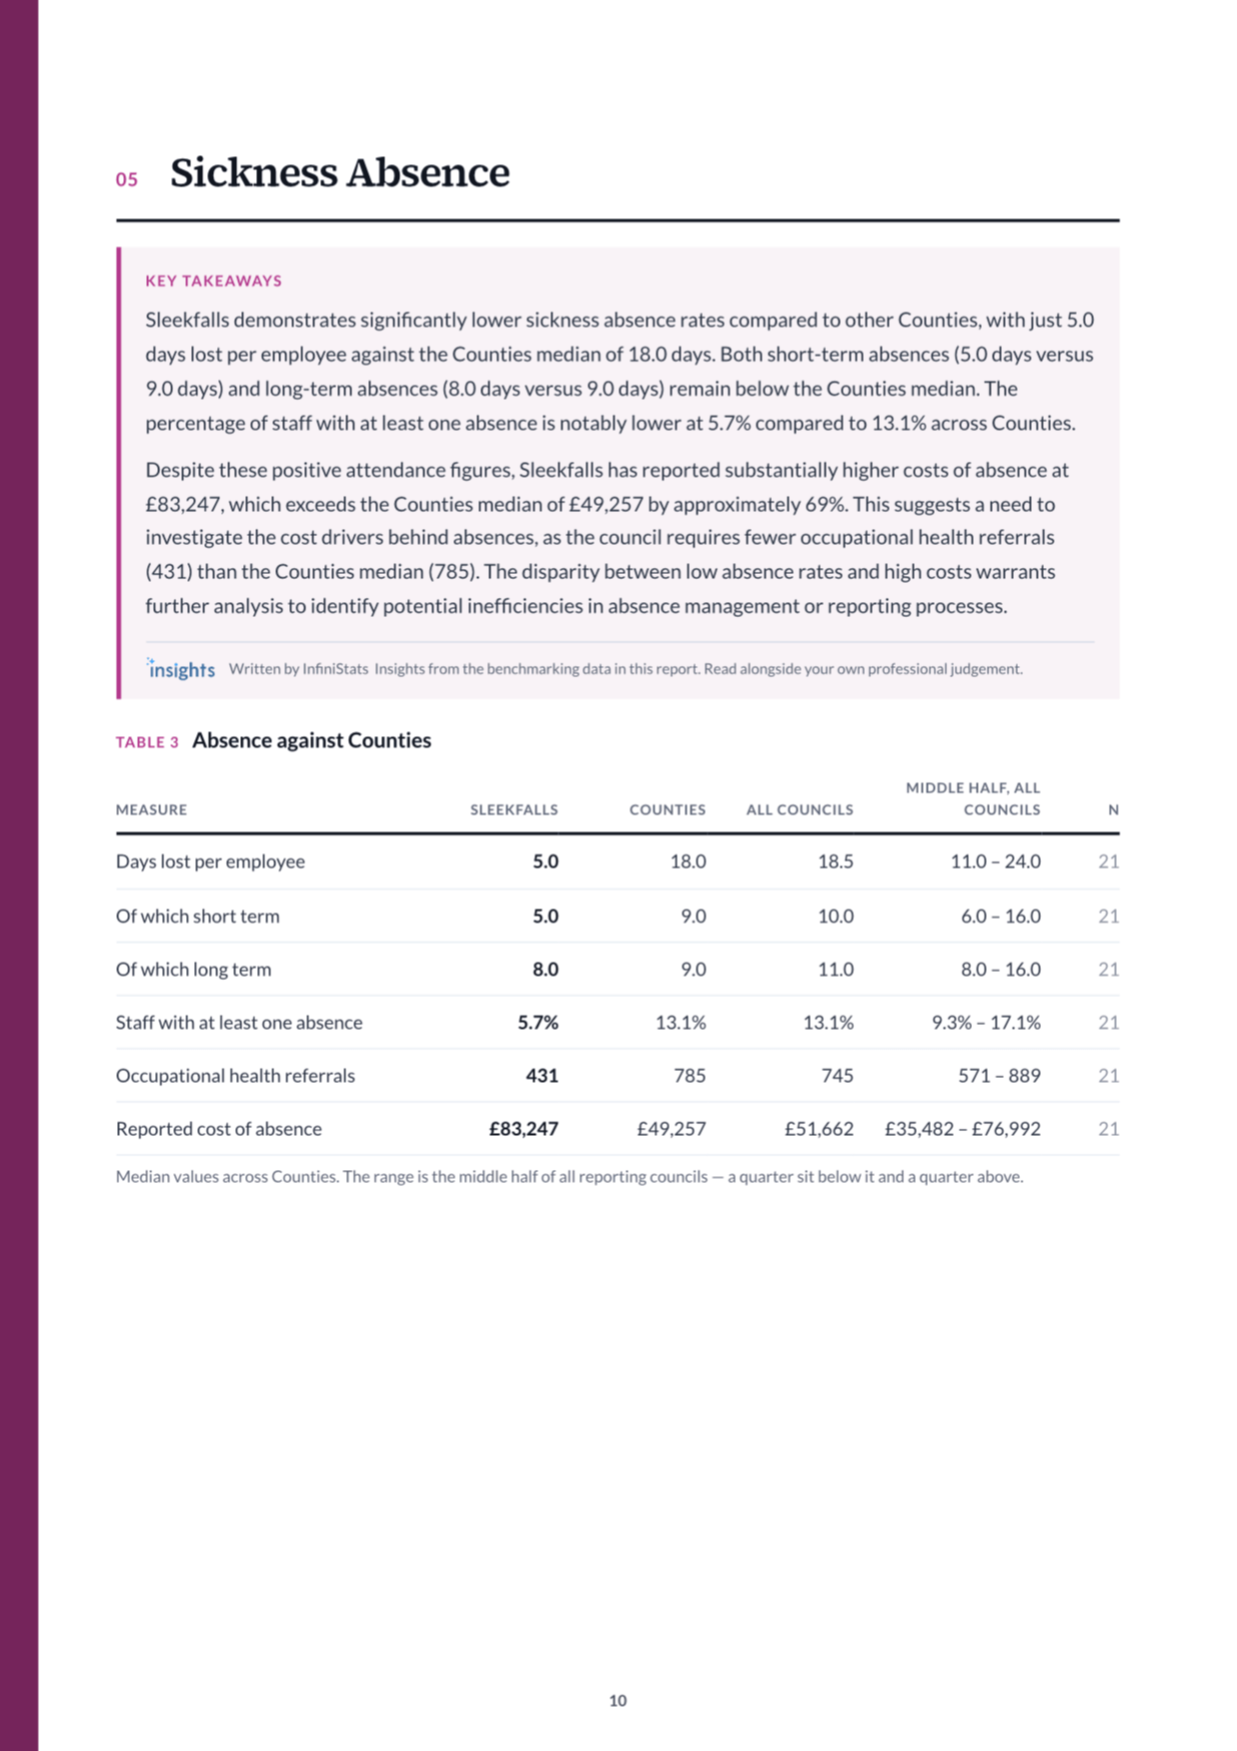
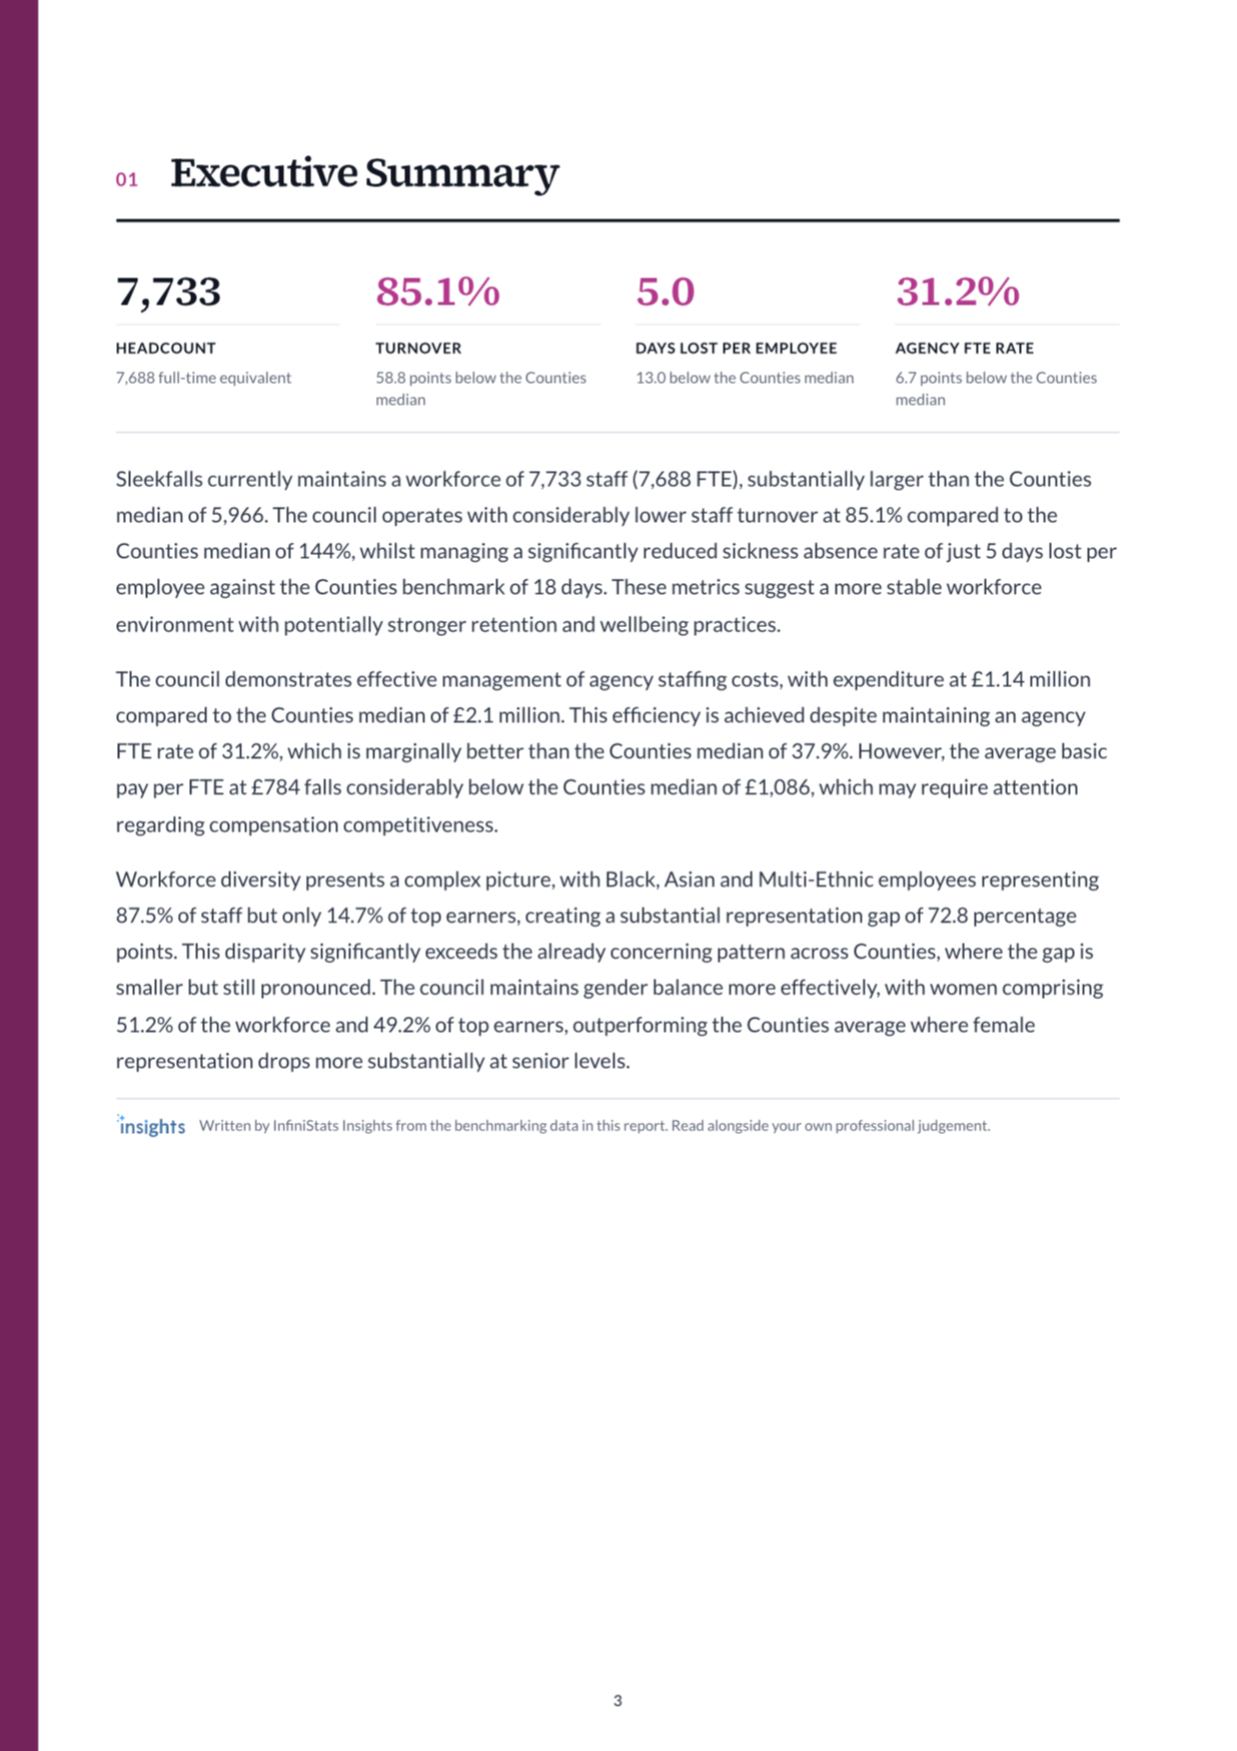
No more hunting through data. Ask what you want to know and Benchy retrieves, compares and visualises the data for you, from a quick lookup to a full report.
Start from an InfiniStats template or build your own. Pull together different charts and visualisations, switch comparators and periods, and share with other users from your council online or export to PDF.
We're reviewing flexible working arrangements ahead of the new policy rollout. Please share your current working patterns and preferences...
Help us plan the 2026/27 training programme by identifying skills gaps and development priorities across departments...

Quickly gather information from colleagues in other councils with custom surveys. Results update live as responses come in.
Discuss findings and share context, turning simple polls into collaborative insights.
Find your closest comparators, so charts, reports and insights are measured like-for-like, against a meaningful peer group.
Everything else you need to get the most from your data — all built in.
Give everyone who needs data access to it, from analysts to directors, at no extra cost
Per-user and per-survey access controls with full or read-only levels
Export your data anytime in Excel or CSV format
Browser-based, no installation, fully platform independent
Printable A3 summaries comparing your metrics at a glance
Interactive maps showing regional comparisons
Get notified when new data or surveys arrive
Track changes with historical comparisons
Built-in checks to catch errors before submission
Reports featuring your logo and colours
Create bespoke comparison groups
Friendly help from platform experts
Trusted since 2012 by HR professionals across Local Government
2026 User Satisfaction Survey conducted by London Councils. Percentage of responding users from HR Benchmarking Club subscriber councils who responded positively to each question.
I've been using InfiniStats for nearly 15 years. It's moved from strength to strength providing useful benchmarking data for London local authorities.
The reporting is brilliant. It's so easy to simply download a benchmarking report, often with analysis such as the Human Capital Metrics dashboard.
InfiniStats is a truly fantastic resource! Having the ability to access a wealth of data and people metrics from numerous local authorities in a centralised repository really helps.
Very useful to benchmark information against other councils, particularly around key areas and conditions.
As a long-term user I have found InfiniStats to be a valuable tool for workforce benchmarking. It is robust with a quick and intuitive interface.
I have used InfiniStats for a number of years. Inputting data couldn't be simpler, with easy-to-follow clear and simple options for downloading.
Clear and precise user interface. Easy to navigate for users, especially retrieving information submitted previously.
Get in touch for a demo or to discuss how InfiniStats can help your organisation.
Contact Us Click here to login
InfiniStats will run in compatibility mode to support your browser. For optimum performance, please use a newer browser such as Chrome, Firefox, Internet Explorer 10+ or Edge.